There will be a lot riding on the hoped-for success of the U.S. manufacturing sector over the decade-plus ahead if the goals concerning carbon emission reductions by mid-century are to be met. There will need to be tremendously large investments in EV production line expansions, new EV battery plants, computer chip-making operations, and in the fabrication of all the building products that will go into renewable electricity generation, utility-sized power storage units, coast-to-coast recharging stations, new hydrogen extraction facilities, and so on.
 Already, in 2022, there has been an unprecedentedly large number of mega-sized industrial projects that have been given go-aheads. One wonders to what extent the Federal Reserve’s current program of aggressive interest rate hikes will slow this work down. For a variety of reasons, as set out in the five following bullet points, perhaps not as much as one might suppose.
Workarounds to Borrowing at a Higher Interest Rate
- For major projects in the auto sector, there are both self-imposed and legislated target dates for achieving zero carbon emissions that will require work to proceed now regardless, given the lengthy time horizon over which construction will need to proceed.
- For many private sector mega projects, projected returns on investment (ROIs) are spread over decades and are not terribly sidetracked by short-term borrowing costs.
- Much of the financing for such projects comes from sources other than bank loans, including profits, dedicated allocations of revenue streams, corporate bond issuances, government tax breaks and/or location enticement grants, and depreciation allowances.
- When bank loans are tapped, often the biggest borrowers can use their prestige or other leverage to shop among lenders for the most favorable repayment rates.
- 特别是对于energ中的最大项目y sector, there will be a spreading of the risk through joint-venture partnership agreements, usually with one namesake leader.
Where the central bank’s interest rate increases really bite is in housing demand (through mortgage rates), car loans and other personal borrowings (to buy stocks, mutual funds, etc.) and business lines of credit (used to meet payrolls and carry both material input and finished goods inventory).
Manufacturing Shipments and New Orders
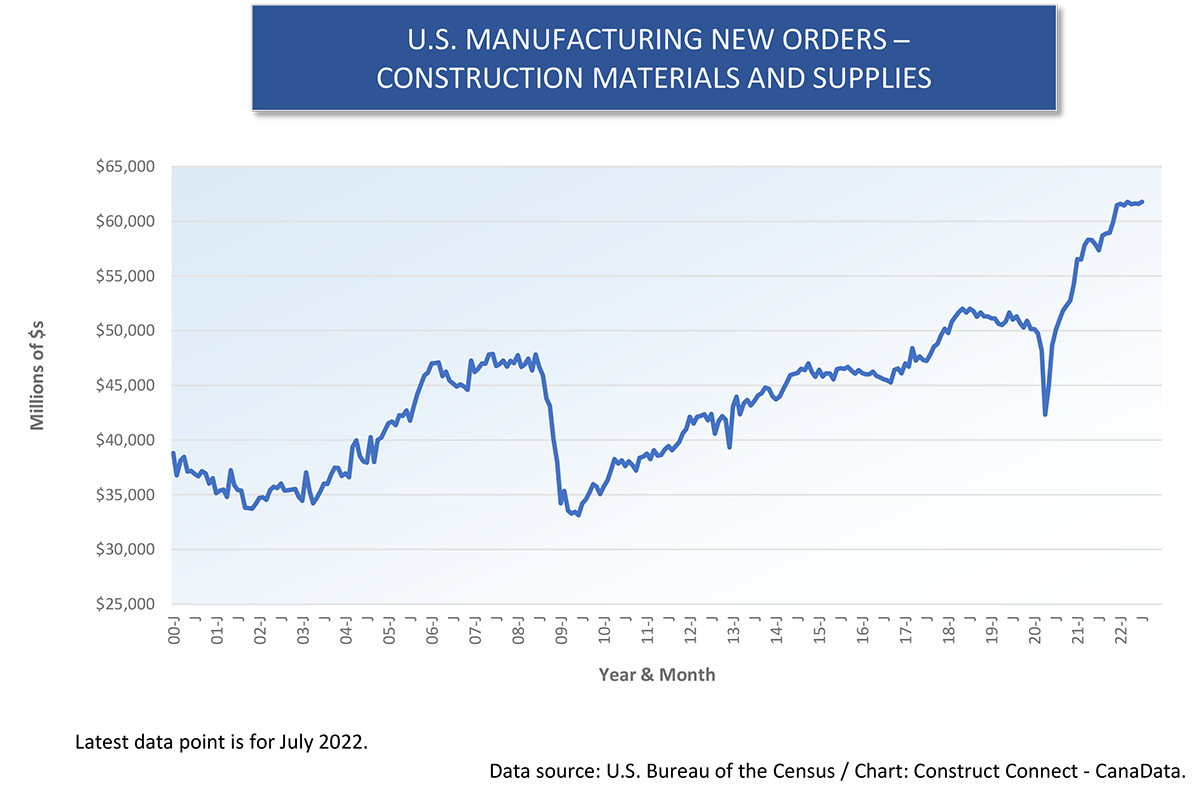
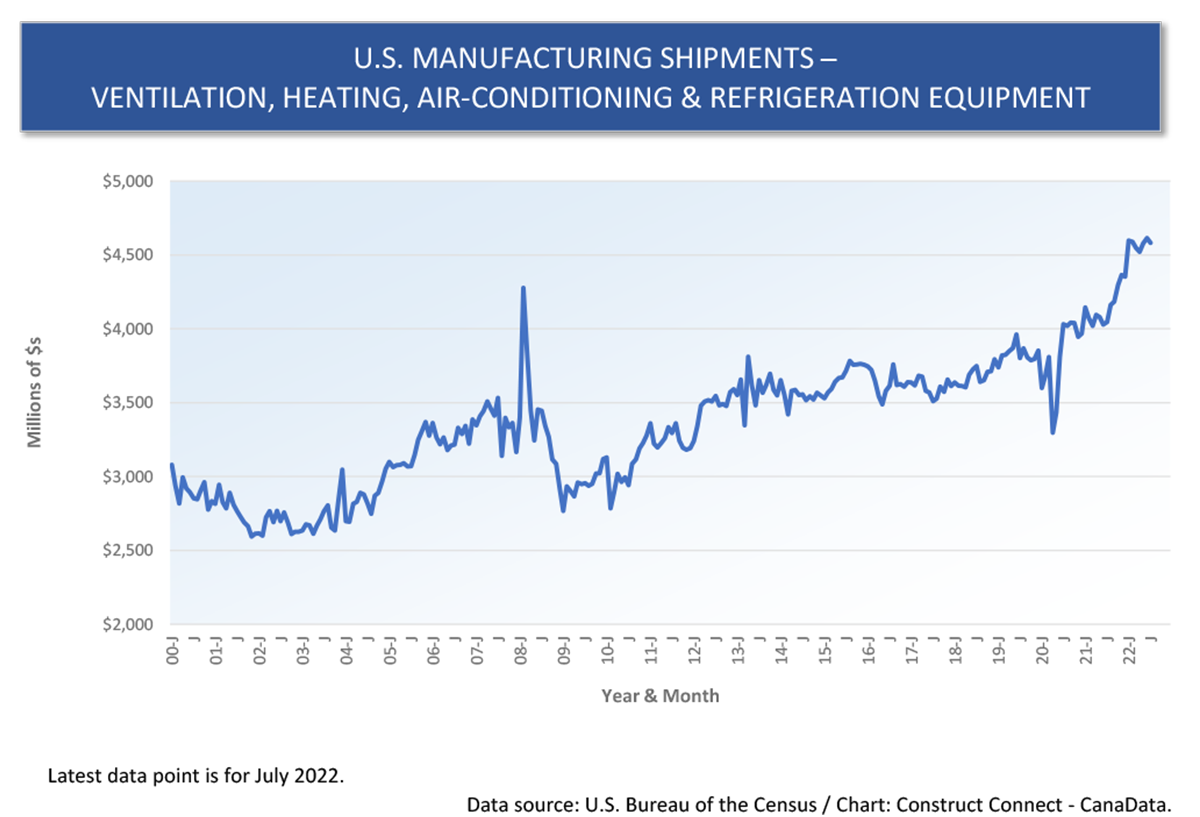
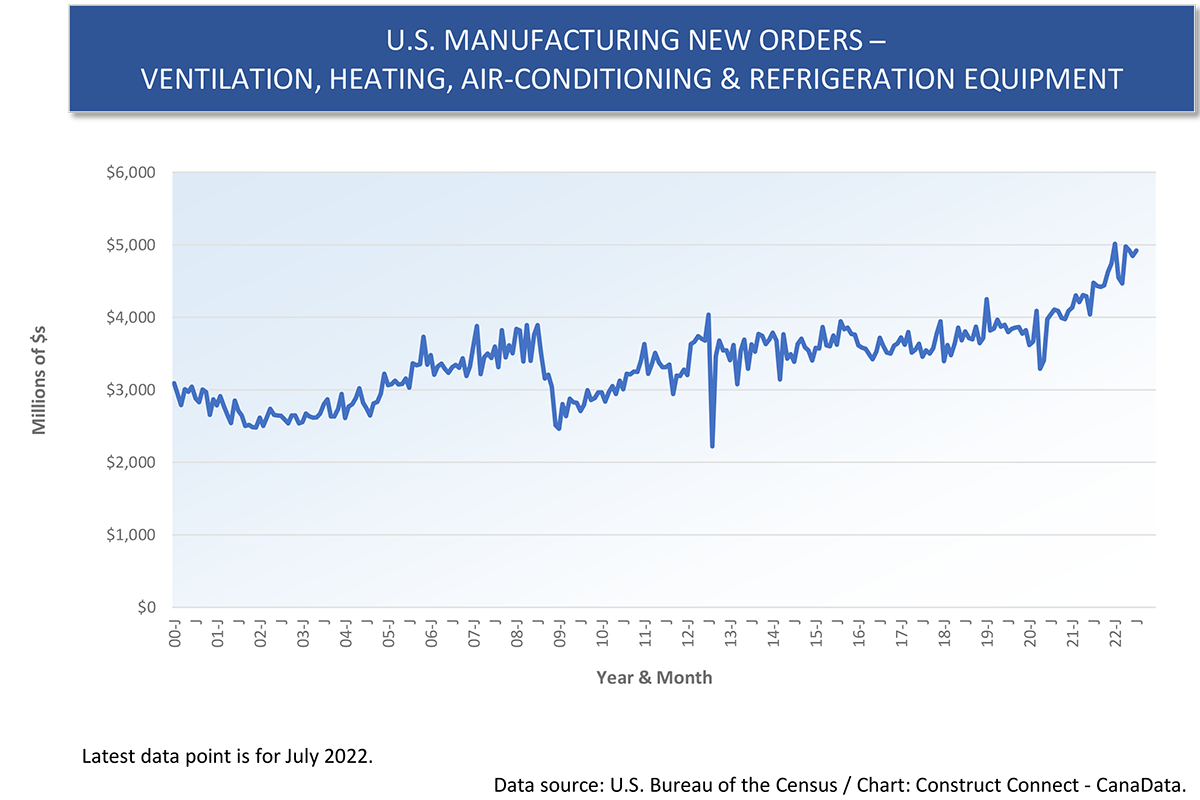
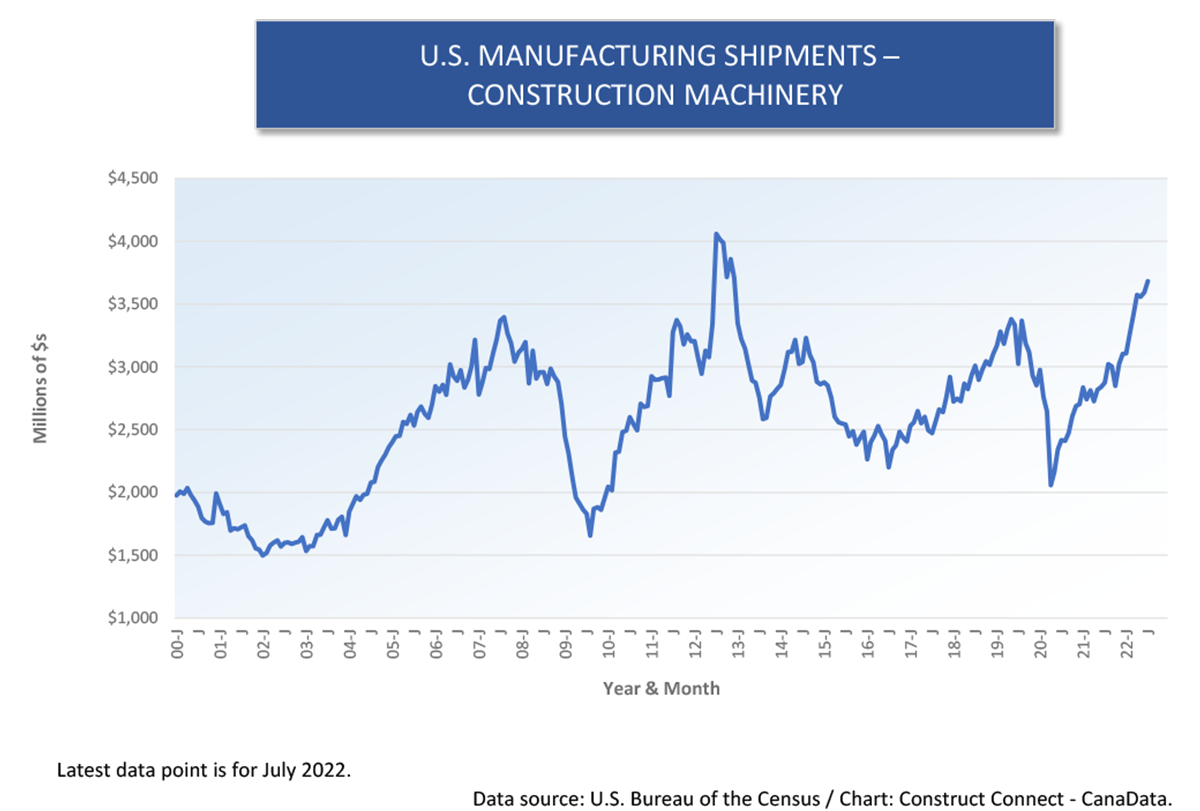
There are 14 graphs below. For total manufacturing and for six sub-sectors, the history of shipments and new orders since the beginning of this century are laid out.
In some instances, a recent flattening of the curve has become evident, but there are no indications, yet, of a recession underway.
Let’s do a review of some of the highlights.
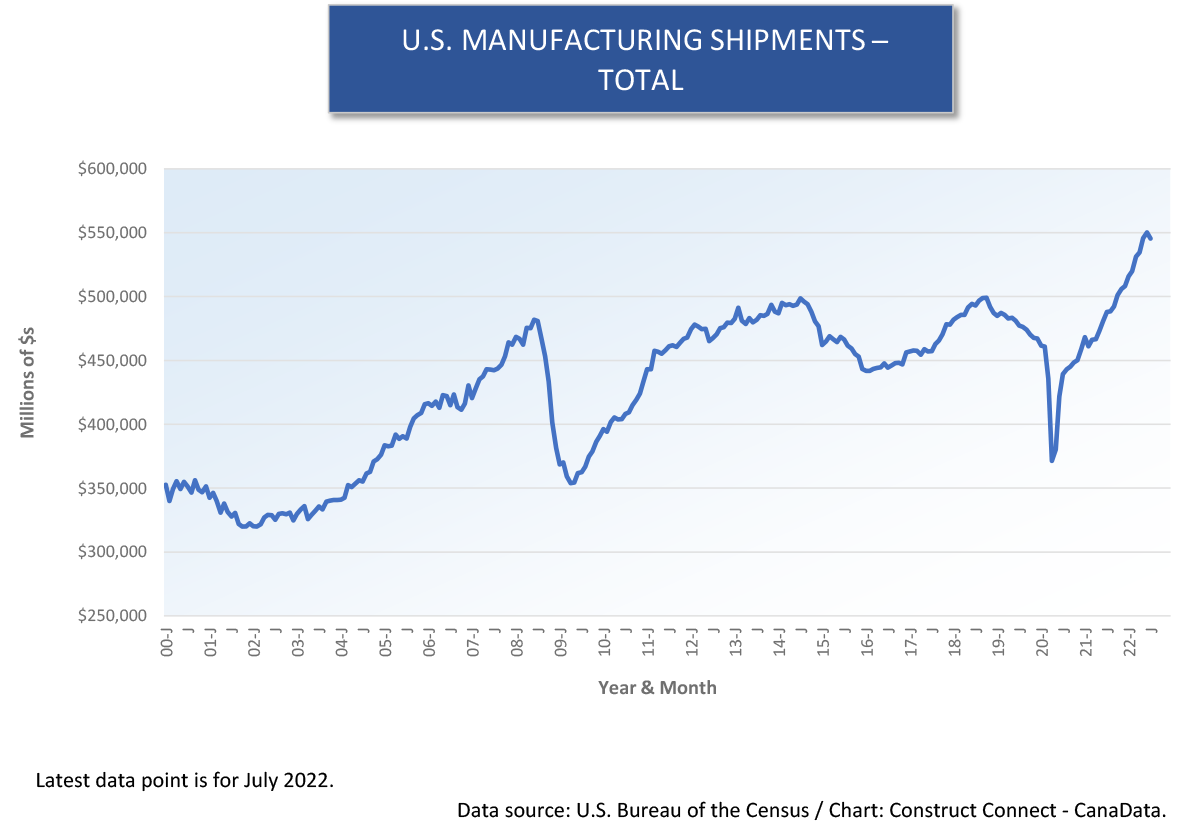
In total manufacturing (Graph 1), the value of shipments, with the exception of a small dip in the latest month, have been soaring since mid-2000. Shipments are expressed in ‘current’ dollars, with no adjustment made for inflation. Therefore, some of the climb is due to price increases.
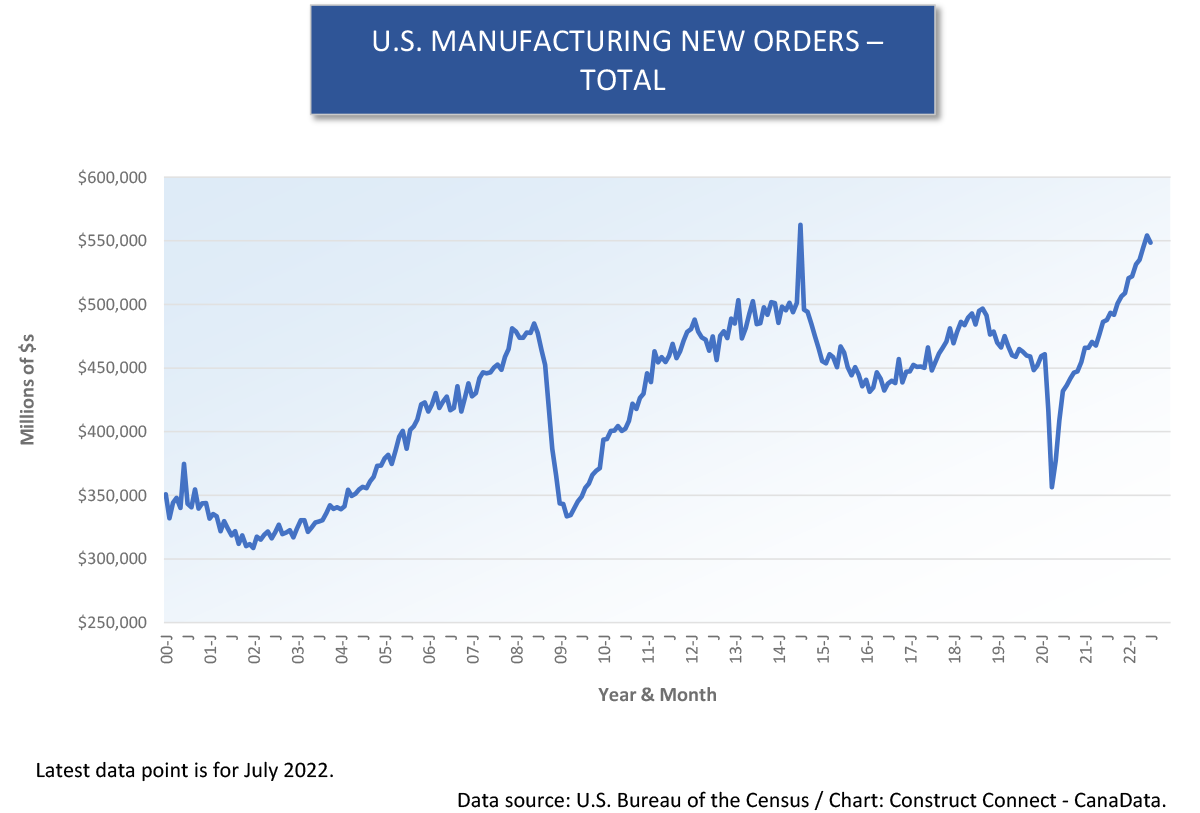
As for total manufacturing’s new orders (Graph 2), they’ve also been exceptionally strong over the past couple of years.
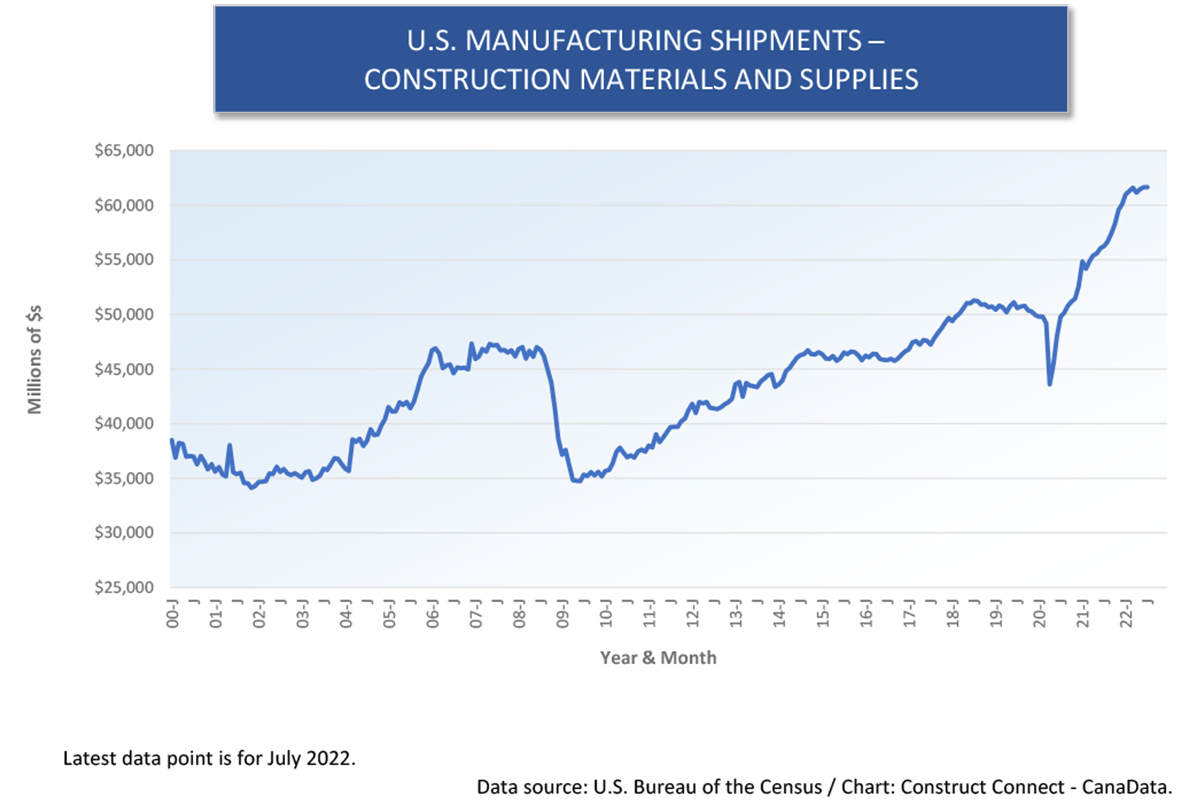
The ‘construction materials and supplies’ shipments and new orders slopes (Graphs 3 and 4) have lately taken off in even more impressive fashion than the total manufacturing slopes, although there has been some leveling off in the last several months. They do, however, remain way above their previous high points.
‘Ventilation, heating, air-conditioning and refrigeration’ (usually compressed into the term HVAC) shipments and new orders (Graphs 5 and 6) appear to be doing fine. They’re on long-term upwards trajectories. With the increasing emphasis on air quality, this has to be a sub-sector with considerable growth potential.
‘Construction machinery’ shipments (Graph 7) have made a good recovery since their plummet at the beginning of the pandemic in early 2020. New orders (Graph 8), however, are sort of plodding along, without a significant breakout from their record dating back to the 2008-09 recession. This will be interesting to watch, if construction heats up to the degree expected a little further along in the 2020s.
Neither shipments nor new orders (Graphs 9 and 10) for ‘mining and oil & gas field machinery’ have returned anywhere close to where they were when domestic ‘fracking’ first became the rage. Again, though, there’s good reason to think they may be on the cusp of doing much better, as the price of energy has perked up dramatically and as a host of other raw materials and commodities are poised for greatly increased demand to carry out the transition to net zero carbon emissions (NZE).
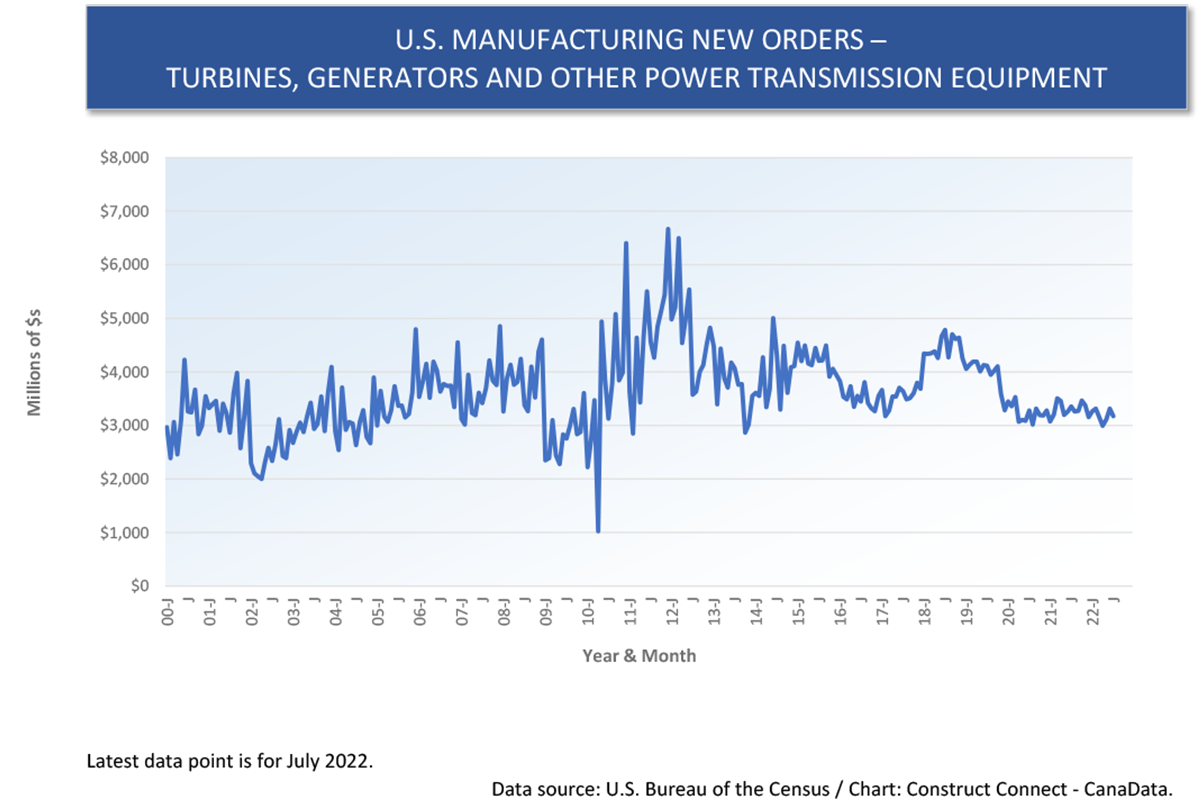
Speaking of which, Graphs 11 and 12 make clear that not enough is presently happening, shipments- or new orders-wise, in the domestic manufacturing of ‘turbines, generators and other power transmission equipment’. Something to ponder on is the undesirable possibility that much of the new business tied to bolstering the internal power generation and distribution network in the U.S. may go to import competitors. That will be an opportunity lost.
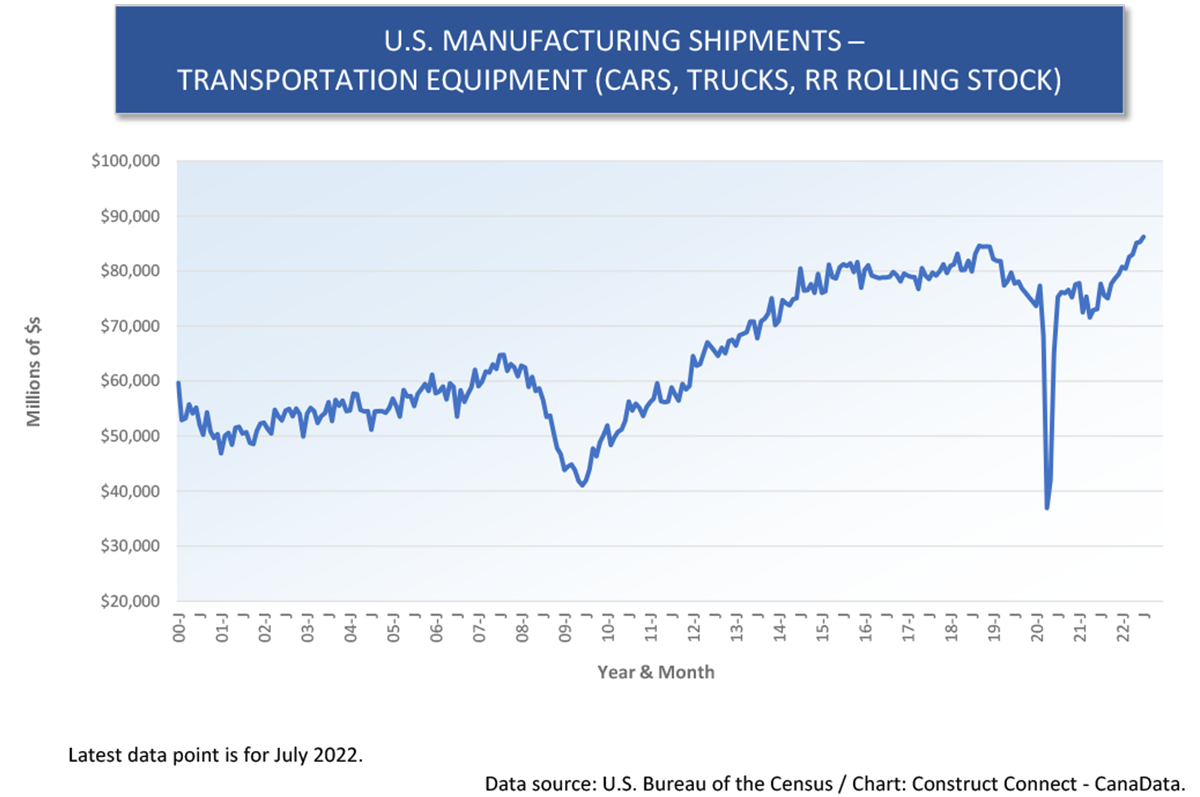
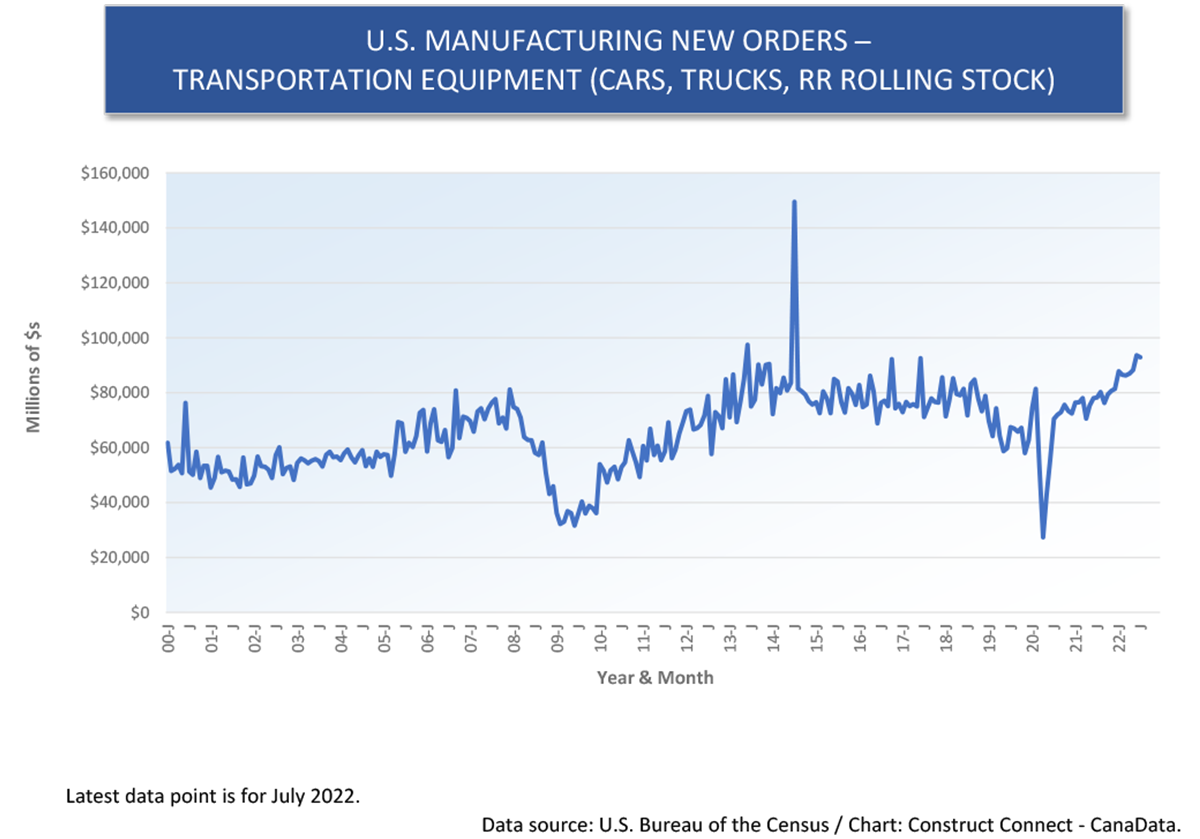
Finally, there are Graphs 13 and 14 to consider. Both shipments and new orders of vehicles have been hampered by an availability issue, with intermittent downtimes for assembly operations caused by an inadequate supply of the microprocessors that ‘boss’ all internal systems, from steering to braking to temperature control. The consequent demand for used vehicles instead has sent their prices into the stratosphere. This will eventually sort itself out. And the demand for transportation equipment, including long-haul trucks and railroad rolling stock, will go hand in hand with concerted efforts to clear up the logistical bottlenecks still making headlines.
Graph 1
Graph 2
Graph 3
Graph 4
Graph 5
Graph 6
Graph 7
Graph 8
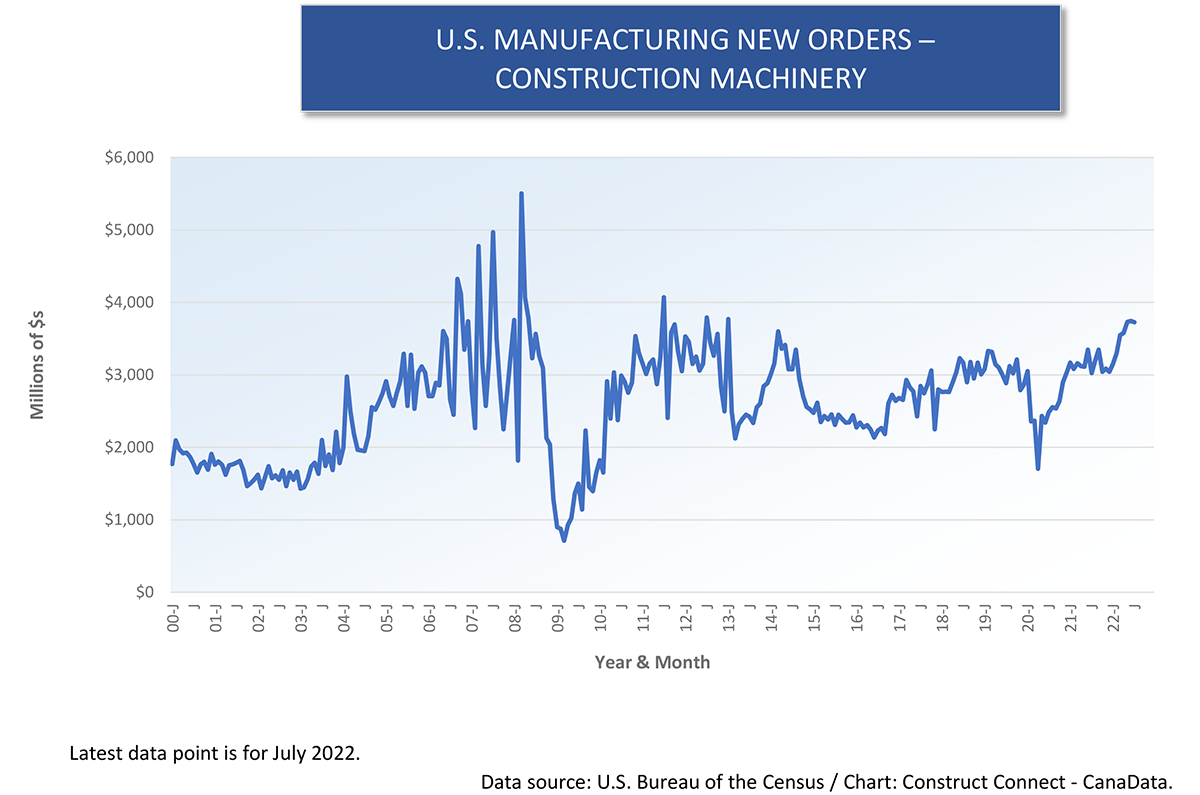
Graph 9
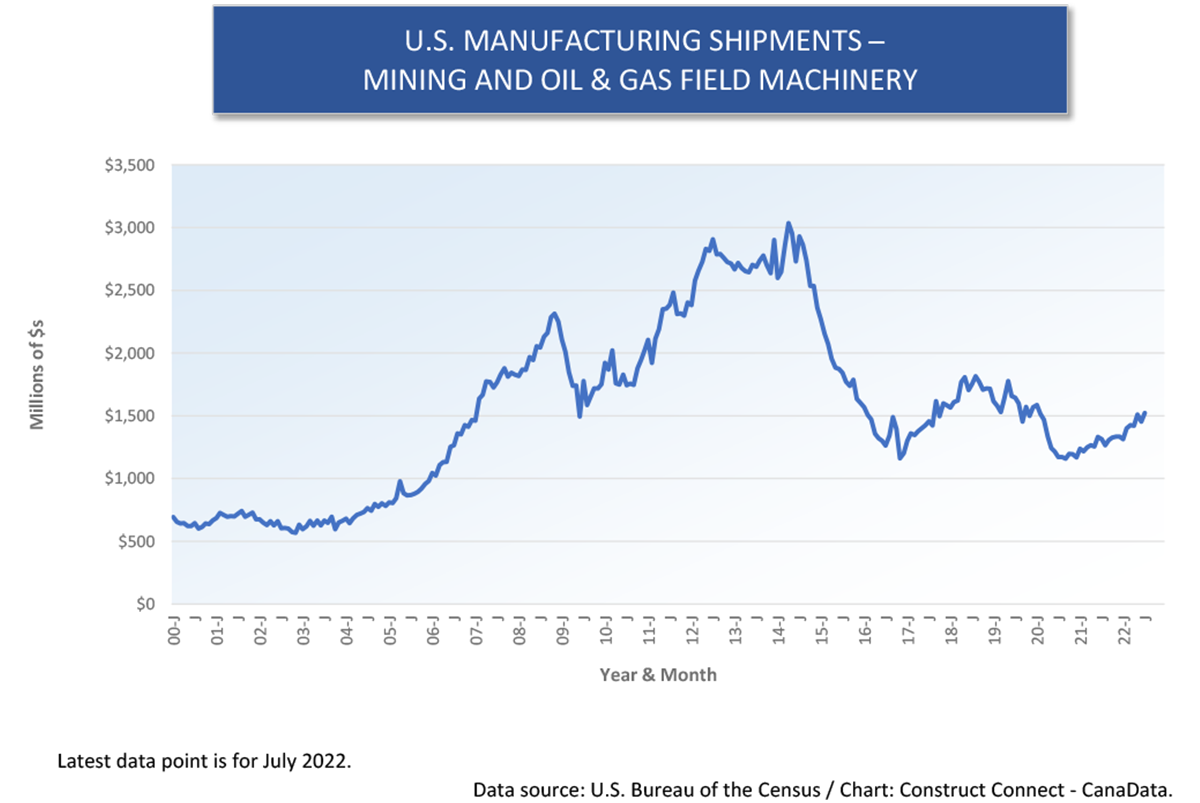
Graph 10
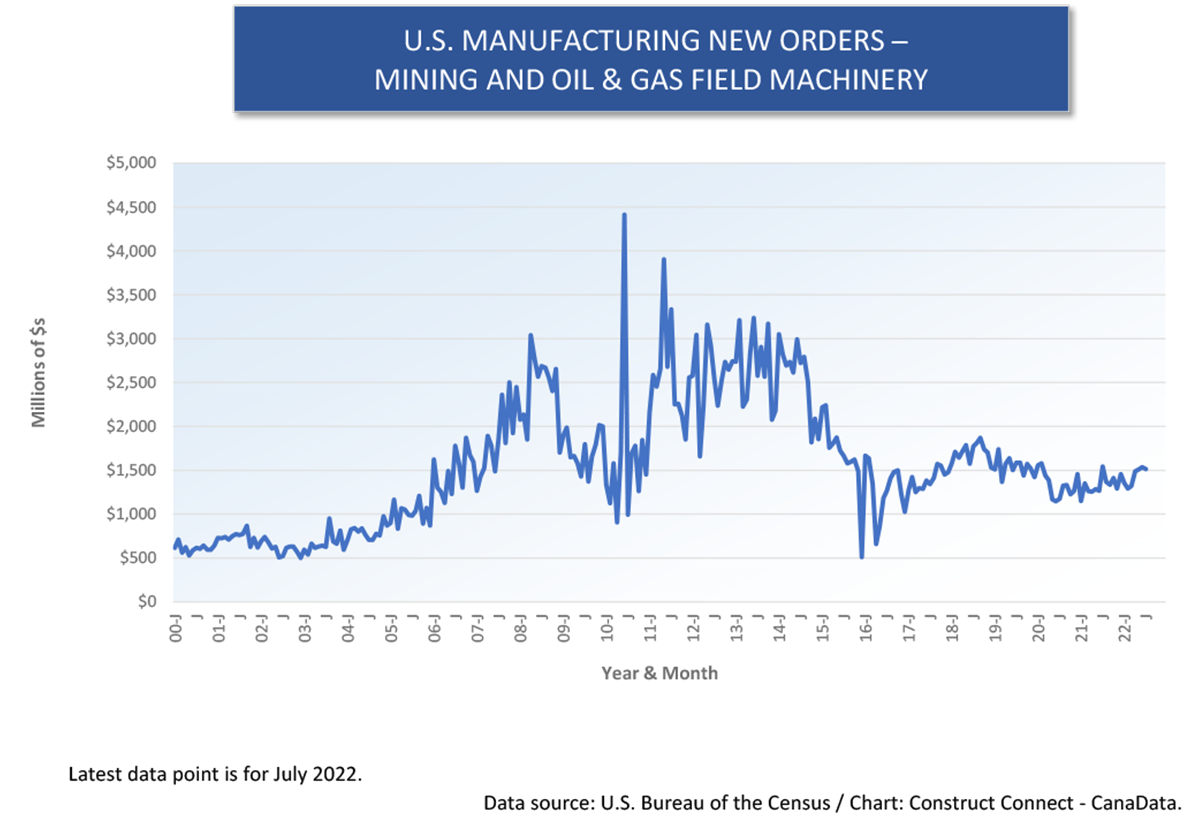
Graph 11
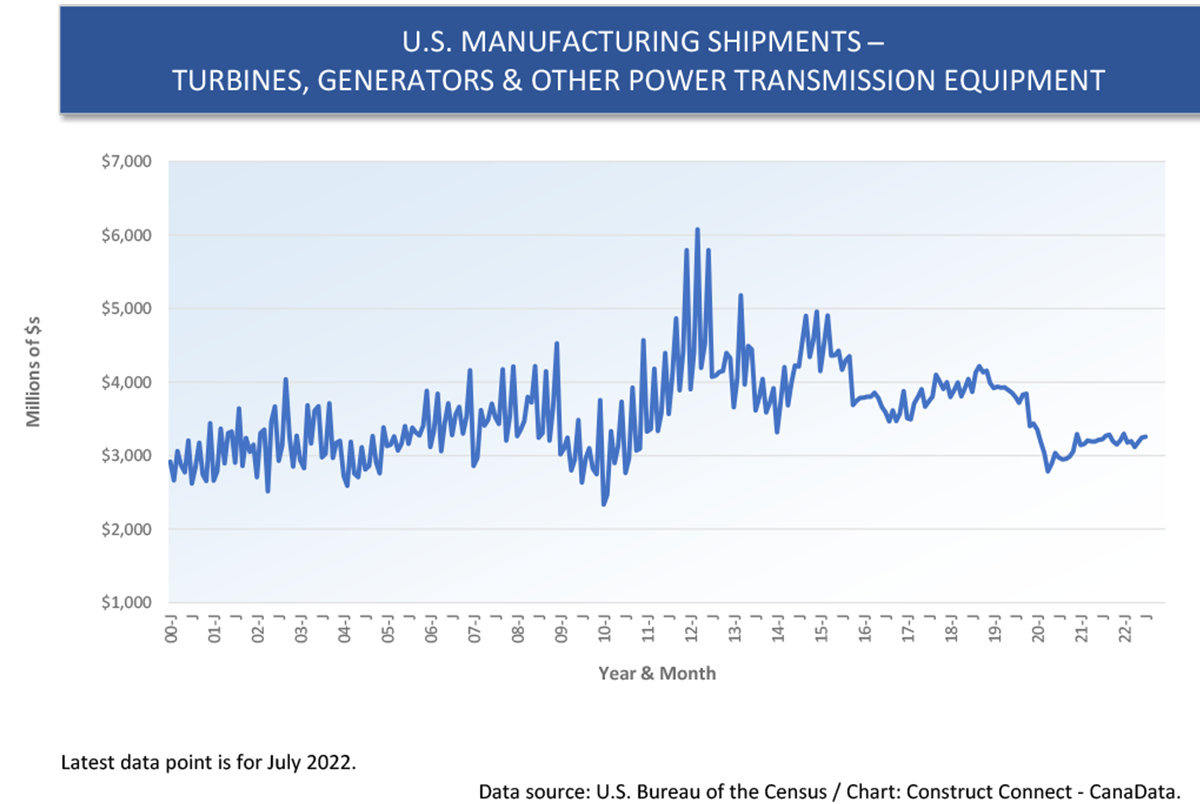
Graph 12
Graph 13
Graph 14
Alex Carrick is Chief Economist for ConstructConnect. He has delivered presentations throughout North America on the U.S., Canadian and world construction outlooks. Mr. Carrick has been with the company since 1985. Links to his numerous articles are featured on Twitter@ConstructConnx, which has 50,000 followers.






Recent Comments
comments for this post are closed